Tutorial: Mixed Triangular-Quadrilateral Mesh#
This tutorial demonstrates how to create a mesh that combines triangular and quadrilateral elements using the Gmsh mesh generator. Quadrilateral elements are preferred in many finite-element and finite-difference groundwater codes because they tend to produce lower numerical diffusion, while triangles provide geometric flexibility near irregular boundaries and stream corridors.
Learning Objectives#
By the end of this tutorial, you will be able to:
Generate a pure triangular mesh with Gmsh
Generate a pure quadrilateral mesh
Generate a mixed tri/quad mesh
Compare element counts and quality across the three modes
Visualize element types in a mixed mesh
Prerequisites#
This tutorial requires the gmsh package (included in the [mesh] or
[all] extras):
pip install pyiwfm[mesh]
Step 1: Define Model Geometry#
We reuse the same boundary, stream, well, and refinement zone from the Tutorial: Mesh Generation tutorial so you can directly compare the Triangle and Gmsh results.
import numpy as np
from pyiwfm.mesh_generation import GmshMeshGenerator
from pyiwfm.mesh_generation.constraints import (
    Boundary,
    StreamConstraint,
    PointConstraint,
    RefinementZone,
)

# Irregular polygon boundary (coordinates in feet)
boundary = Boundary(vertices=np.array([
    [0.0, 0.0],
    [5000.0, 0.0],
    [6000.0, 1000.0],
    [6000.0, 4000.0],
    [5000.0, 5000.0],
    [3000.0, 5500.0],
    [1000.0, 5000.0],
    [0.0, 3000.0],
]))

# Main river
river = StreamConstraint(
    vertices=np.array([
        [5500.0, 4500.0],
        [4000.0, 3500.0],
        [3000.0, 3000.0],
        [2000.0, 2000.0],
        [500.0, 1000.0],
    ]),
    stream_id=1,
)

# Well locations
wells = [
    PointConstraint(x=1500.0, y=3500.0),
    PointConstraint(x=3500.0, y=4000.0),
    PointConstraint(x=4500.0, y=2500.0),
    PointConstraint(x=2000.0, y=1000.0),
]

# Refinement zone in the northern area
refine = RefinementZone(
    polygon=np.array([
        [1000.0, 3000.0],
        [4500.0, 3000.0],
        [4500.0, 4500.0],
        [1000.0, 4500.0],
    ]),
    max_area=10000.0,
)
Step 2: Generate Three Mesh Variants#
GmshMeshGenerator accepts an element_type parameter:
"triangle"– pure triangular mesh (default)"quad"– pure quadrilateral mesh via the Frontal-Delaunay for quads algorithm"mixed"– Blossom recombination that merges triangle pairs into quads where possible, leaving triangles near irregular geometry
results = {}
for etype in ("triangle", "mixed", "quad"):
    gen = GmshMeshGenerator(element_type=etype)
    result = gen.generate(
        boundary=boundary,
        streams=[river],
        points=wells,
        refinement_zones=[refine],
        max_area=50000.0,
        min_angle=25.0,
    )
    results[etype] = result
    grid = result.to_appgrid()
    print(
        f"{etype:>8}: {grid.n_nodes:>4} nodes, {grid.n_elements:>4} elements "
        f"(tri={result.n_triangles}, quad={result.n_quads})"
    )
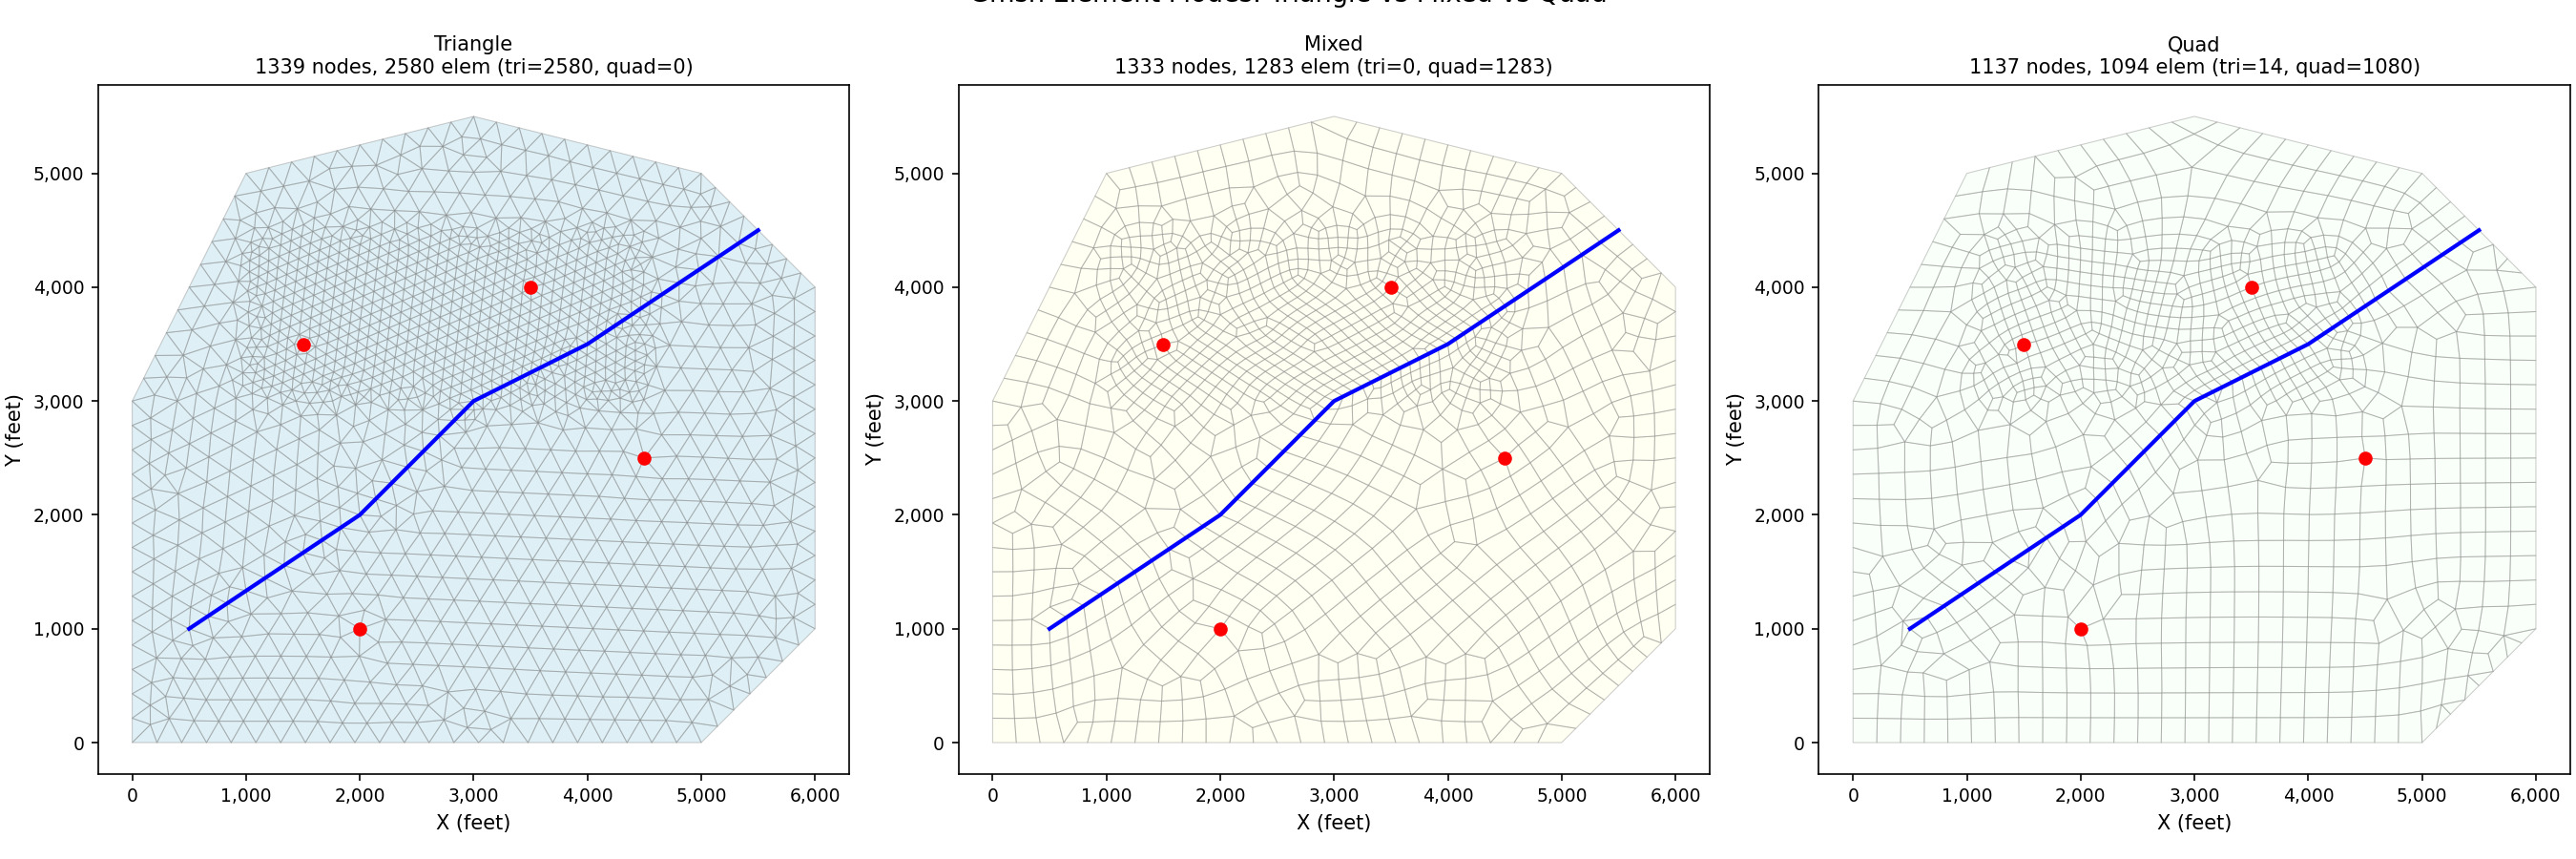
Step 3: Visualize All Three Modes Side by Side#
import numpy as np
import matplotlib.pyplot as plt
from pyiwfm.mesh_generation import GmshMeshGenerator
from pyiwfm.mesh_generation.constraints import (
    Boundary, StreamConstraint, PointConstraint, RefinementZone,
)
from pyiwfm.visualization.plotting import plot_mesh

boundary = Boundary(vertices=np.array([
    [0, 0], [5000, 0], [6000, 1000], [6000, 4000],
    [5000, 5000], [3000, 5500], [1000, 5000], [0, 3000],
]))
river = StreamConstraint(vertices=np.array([
    [5500, 4500], [4000, 3500], [3000, 3000], [2000, 2000], [500, 1000],
]))
wells = [
    PointConstraint(x=1500, y=3500), PointConstraint(x=3500, y=4000),
    PointConstraint(x=4500, y=2500), PointConstraint(x=2000, y=1000),
]
refine = RefinementZone(
    polygon=np.array([[1000, 3000], [4500, 3000], [4500, 4500], [1000, 4500]]),
    max_area=10000.0,
)

fig, axes = plt.subplots(1, 3, figsize=(18, 6))
colors = {'triangle': 'lightblue', 'mixed': 'lightyellow', 'quad': 'honeydew'}

for ax, etype in zip(axes, ('triangle', 'mixed', 'quad')):
    gen = GmshMeshGenerator(element_type=etype)
    result = gen.generate(
        boundary=boundary, streams=[river], points=wells,
        refinement_zones=[refine], max_area=50000.0, min_angle=25.0,
    )
    grid = result.to_appgrid()
    _, ax2 = plot_mesh(grid, show_edges=True, edge_color='gray',
                       fill_color=colors[etype], alpha=0.4, ax=ax)
    ax.plot([5500, 4000, 3000, 2000, 500], [4500, 3500, 3000, 2000, 1000],
            'b-', linewidth=2)
    for pc in wells:
        ax.plot(pc.x, pc.y, 'ro', markersize=6, zorder=5)
    ax.set_title(
        f'{etype.capitalize()}\n'
        f'{grid.n_nodes} nodes, {grid.n_elements} elem '
        f'(tri={result.n_triangles}, quad={result.n_quads})',
        fontsize=10,
    )
    ax.set_xlabel('X (feet)')
    ax.set_ylabel('Y (feet)')

plt.suptitle('Gmsh Element Modes: Triangle vs Mixed vs Quad', fontsize=13, y=1.02)
plt.show()
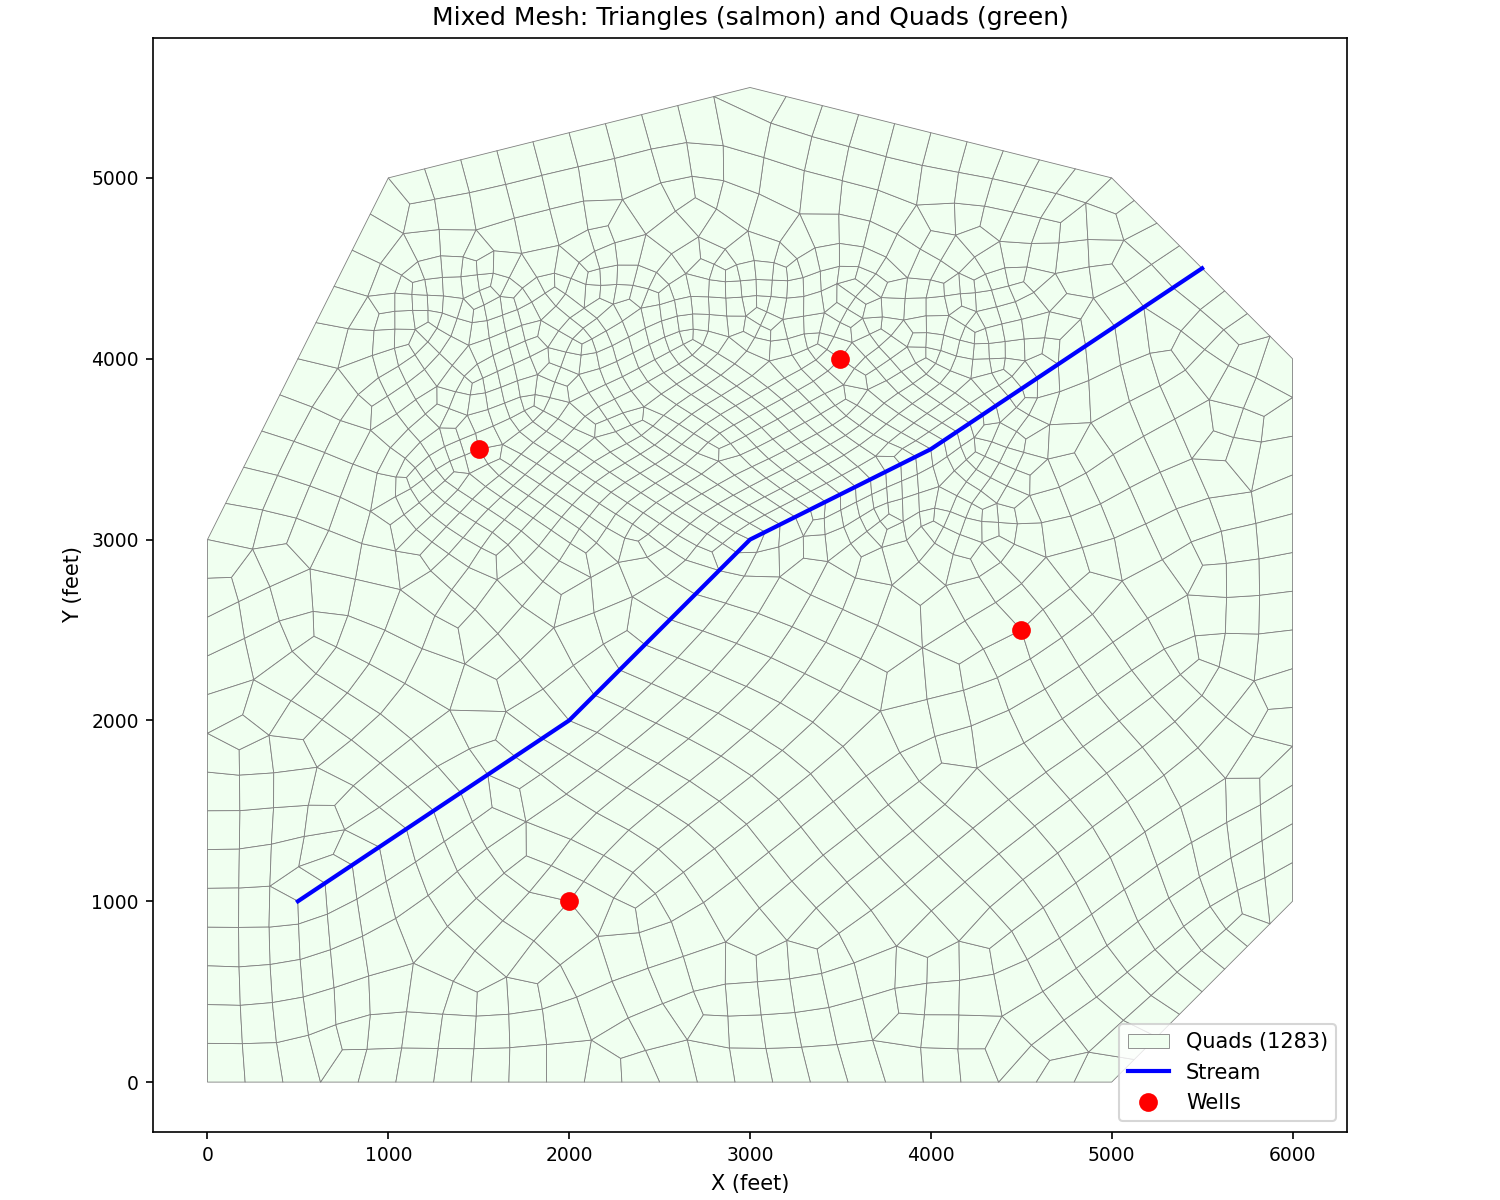
Step 4: Color Elements by Type in a Mixed Mesh#
In a mixed mesh it is useful to see which elements are triangles and which are quads. We color each element by its vertex count.
from matplotlib.collections import PolyCollection

gen = GmshMeshGenerator(element_type="mixed")
result = gen.generate(
    boundary=boundary,
    streams=[river],
    points=wells,
    refinement_zones=[refine],
    max_area=50000.0,
    min_angle=25.0,
)
grid = result.to_appgrid()

tri_polys, quad_polys = [], []
for elem in grid.elements.values():
    coords = [(grid.nodes[v].x, grid.nodes[v].y) for v in elem.vertices]
    if len(elem.vertices) == 3:
        tri_polys.append(coords)
    else:
        quad_polys.append(coords)

fig, ax = plt.subplots(figsize=(10, 8))
if quad_polys:
    pc_q = PolyCollection(quad_polys, facecolor="honeydew", edgecolor="gray",
                          linewidth=0.4, label=f"Quads ({len(quad_polys)})")
    ax.add_collection(pc_q)
if tri_polys:
    pc_t = PolyCollection(tri_polys, facecolor="lightsalmon", edgecolor="gray",
                          linewidth=0.4, label=f"Triangles ({len(tri_polys)})")
    ax.add_collection(pc_t)
ax.autoscale()
ax.set_aspect("equal")
ax.legend(fontsize=11)
ax.set_xlabel("X (feet)")
ax.set_ylabel("Y (feet)")
ax.set_title("Mixed Mesh: Triangles (salmon) and Quads (green)")
import numpy as np
import matplotlib.pyplot as plt
from matplotlib.collections import PolyCollection
from pyiwfm.mesh_generation import GmshMeshGenerator
from pyiwfm.mesh_generation.constraints import (
    Boundary, StreamConstraint, PointConstraint, RefinementZone,
)

boundary = Boundary(vertices=np.array([
    [0, 0], [5000, 0], [6000, 1000], [6000, 4000],
    [5000, 5000], [3000, 5500], [1000, 5000], [0, 3000],
]))
river = StreamConstraint(vertices=np.array([
    [5500, 4500], [4000, 3500], [3000, 3000], [2000, 2000], [500, 1000],
]))
wells = [
    PointConstraint(x=1500, y=3500), PointConstraint(x=3500, y=4000),
    PointConstraint(x=4500, y=2500), PointConstraint(x=2000, y=1000),
]
refine = RefinementZone(
    polygon=np.array([[1000, 3000], [4500, 3000], [4500, 4500], [1000, 4500]]),
    max_area=10000.0,
)

gen = GmshMeshGenerator(element_type='mixed')
result = gen.generate(
    boundary=boundary, streams=[river], points=wells,
    refinement_zones=[refine], max_area=50000.0, min_angle=25.0,
)
grid = result.to_appgrid()

tri_polys, quad_polys = [], []
for elem in grid.elements.values():
    coords = [(grid.nodes[v].x, grid.nodes[v].y) for v in elem.vertices]
    if len(elem.vertices) == 3:
        tri_polys.append(coords)
    else:
        quad_polys.append(coords)

fig, ax = plt.subplots(figsize=(10, 8))
if quad_polys:
    pc_q = PolyCollection(quad_polys, facecolor='honeydew', edgecolor='gray',
                          linewidth=0.4, label=f'Quads ({len(quad_polys)})')
    ax.add_collection(pc_q)
if tri_polys:
    pc_t = PolyCollection(tri_polys, facecolor='lightsalmon', edgecolor='gray',
                          linewidth=0.4, label=f'Triangles ({len(tri_polys)})')
    ax.add_collection(pc_t)
ax.plot([5500, 4000, 3000, 2000, 500], [4500, 3500, 3000, 2000, 1000],
        'b-', linewidth=2, label='Stream')
for pc in wells:
    ax.plot(pc.x, pc.y, 'ro', markersize=8, zorder=5)
ax.plot([], [], 'ro', markersize=8, label='Wells')
ax.autoscale()
ax.set_aspect('equal')
ax.legend(fontsize=10, loc='lower right')
ax.set_xlabel('X (feet)')
ax.set_ylabel('Y (feet)')
ax.set_title('Mixed Mesh: Triangles (salmon) and Quads (green)')
plt.show()
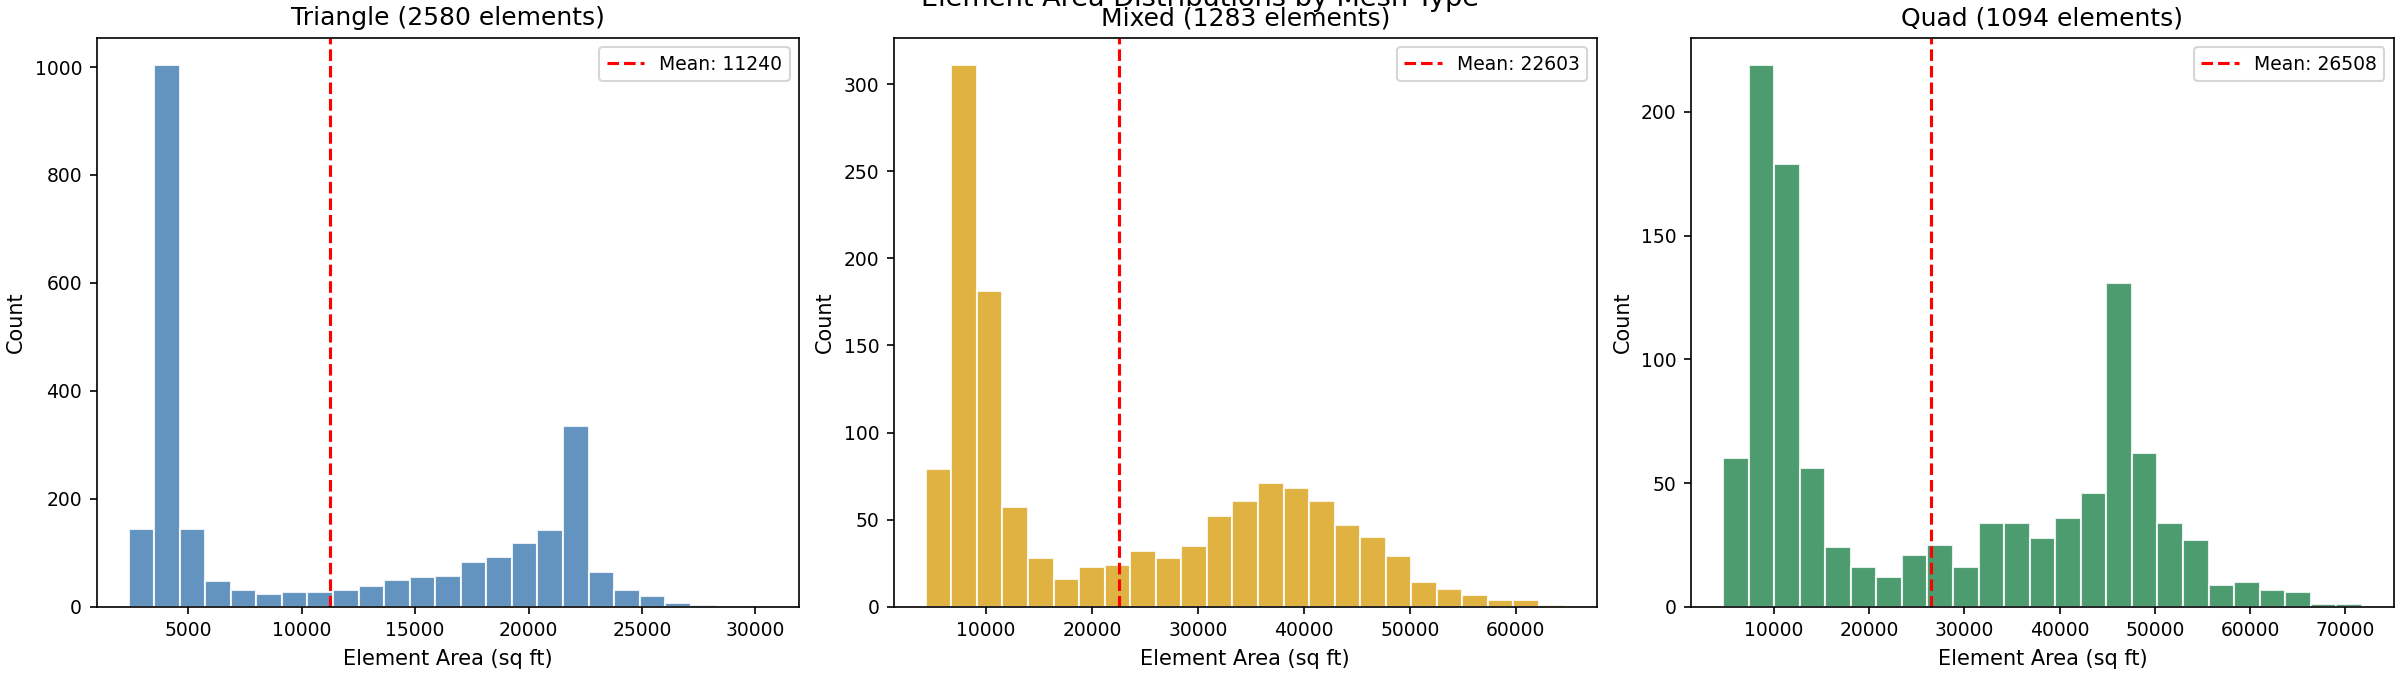
Step 5: Compare Element Area Distributions#
import numpy as np
import matplotlib.pyplot as plt
from pyiwfm.mesh_generation import GmshMeshGenerator
from pyiwfm.mesh_generation.constraints import (
    Boundary, StreamConstraint, PointConstraint, RefinementZone,
)

boundary = Boundary(vertices=np.array([
    [0, 0], [5000, 0], [6000, 1000], [6000, 4000],
    [5000, 5000], [3000, 5500], [1000, 5000], [0, 3000],
]))
river = StreamConstraint(vertices=np.array([
    [5500, 4500], [4000, 3500], [3000, 3000], [2000, 2000], [500, 1000],
]))
wells = [
    PointConstraint(x=1500, y=3500), PointConstraint(x=3500, y=4000),
    PointConstraint(x=4500, y=2500), PointConstraint(x=2000, y=1000),
]
refine = RefinementZone(
    polygon=np.array([[1000, 3000], [4500, 3000], [4500, 4500], [1000, 4500]]),
    max_area=10000.0,
)

fig, axes = plt.subplots(1, 3, figsize=(16, 4.5))
colors = {'triangle': 'steelblue', 'mixed': 'goldenrod', 'quad': 'seagreen'}

for ax, etype in zip(axes, ('triangle', 'mixed', 'quad')):
    gen = GmshMeshGenerator(element_type=etype)
    result = gen.generate(
        boundary=boundary, streams=[river], points=wells,
        refinement_zones=[refine], max_area=50000.0, min_angle=25.0,
    )
    areas = result.get_element_areas()
    ax.hist(areas, bins=25, color=colors[etype], edgecolor='white', alpha=0.85)
    ax.axvline(areas.mean(), color='red', linestyle='--',
               label=f'Mean: {areas.mean():.0f}')
    ax.set_xlabel('Element Area (sq ft)')
    ax.set_ylabel('Count')
    ax.set_title(f'{etype.capitalize()} ({len(areas)} elements)')
    ax.legend(fontsize=9)

plt.suptitle('Element Area Distributions by Mesh Type', fontsize=13, y=1.02)
plt.show()
Step 6: Convert and Export#
The MeshResult returned by any mode converts to an AppGrid identically.
Triangles have 3-vertex tuples and quads have 4-vertex tuples, which IWFM
natively supports.
from pyiwfm.visualization import GISExporter

gen = GmshMeshGenerator(element_type="mixed")
result = gen.generate(
    boundary=boundary,
    streams=[river],
    points=wells,
    refinement_zones=[refine],
    max_area=50000.0,
    min_angle=25.0,
)
grid = result.to_appgrid()

print(f"Nodes: {grid.n_nodes}")
print(f"Elements: {grid.n_elements}")
print(f"  Triangles: {result.n_triangles}")
print(f"  Quads: {result.n_quads}")

# Export to GeoPackage
exporter = GISExporter(grid=grid, crs="EPSG:2227")
exporter.export_geopackage("mixed_mesh.gpkg")
Complete Script#
"""Generate a mixed triangular-quadrilateral mesh."""

import numpy as np
from pyiwfm.mesh_generation import GmshMeshGenerator
from pyiwfm.mesh_generation.constraints import (
    Boundary, StreamConstraint, PointConstraint, RefinementZone,
)
from pyiwfm.visualization import GISExporter

boundary = Boundary(vertices=np.array([
    [0, 0], [5000, 0], [6000, 1000], [6000, 4000],
    [5000, 5000], [3000, 5500], [1000, 5000], [0, 3000],
]))
river = StreamConstraint(vertices=np.array([
    [5500, 4500], [4000, 3500], [3000, 3000], [2000, 2000], [500, 1000],
]))
wells = [PointConstraint(x=1500, y=3500), PointConstraint(x=3500, y=4000)]
refine = RefinementZone(
    polygon=np.array([[1000, 3000], [4500, 3000], [4500, 4500], [1000, 4500]]),
    max_area=10000,
)

gen = GmshMeshGenerator(element_type="mixed")
result = gen.generate(
    boundary=boundary,
    streams=[river],
    points=wells,
    refinement_zones=[refine],
    max_area=50000,
    min_angle=25,
)
grid = result.to_appgrid()

print(f"Nodes: {grid.n_nodes}, Tri: {result.n_triangles}, Quad: {result.n_quads}")

exporter = GISExporter(grid=grid, crs="EPSG:2227")
exporter.export_geopackage("mixed_mesh.gpkg")
Next Steps#
Compare the mixed mesh with the pure Triangle mesh from the Tutorial: Mesh Generation tutorial to see how element shape affects simulation accuracy
Add stratigraphy and run an IWFM simulation
Use the web viewer to inspect the mesh in 3D